Journal of Civil Engineering and Environmental Sciences
Water Quality Modeling of Wastewater Discharges for Prediction of Sediment Transport and Deposition in Surface Water
JI Ubah*, LC Orakwe, ICE Umeghalu, KN Ogbu and EC Chukwuma
Department of Agricultural and Bioresources Engineering, Nnamdi Azikiwe University Awka, Nigeria
Cite this as
Ubah JI, Orakwe LC, Umeghalu ICE, Ogbu KN, Chukwuma EC. Water Quality Modeling of Wastewater Discharges for Prediction of Sediment Transport and Deposition in Surface Water. J Civil Eng Environ Sci. 2024;10(2): 073-078. Available from: 10.17352/2455-488X.000088Copyright License
© 2024 Ubah JI, et al. This is an open-access article distributed under the terms of the Creative Commons Attribution License, which permits unrestricted use, distribution, and reproduction in any medium, provided the original author and source are credited.Sediment deposition in surface water bodies can have a range of significant impacts, affecting everything from the aquatic ecosystem to water quality and infrastructure. It can affect the availability of food sources for aquatic organisms; and change the physical structure of habitats, such as riverbeds and lake bottoms. It can equally smother aquatic plants and animals, leading to a decline in biodiversity. A model of the governing equations of particle motion and fluid flow was developed with COMSOL Multiphysics 5.3a. With a coefficient of determination of 0.99, the model result demonstrated good agreement after result validation using experimental data. According to study findings, sediments in the study area, Ele River move more slowly than sediments in the midstream which causes a high deposition of sediments at the river banks. This sediment deposition affects the irrigation system for crop production considering the ability of the sediments to block sprinkler nozzles which limits it from supplying sufficient water for the production of crops.
1. Introduction
Industrial wastewater often contains hazardous chemicals including heavy metals, organic pollutants, and toxic substances that can contaminate surface waters. Since sediment deposition alters the volume of flow against the natural bathymetry, sediments have a substantial impact on the flow characteristics of the river [1]. Sediments in surface water originate from natural sources like soil erosion, weathering of rocks and organic matter, as well as anthropogenic activities such as construction, mining, agriculture, and deforestation. Coarse particles like gravel and sand roll, slide or bounce along the riverbed due to water flow. Finer particles like silt and clay that remain suspended in the water column are carried by the flow while soluble materials are carried in solution, such as minerals and salts.
Nutrient-rich wastewater, particularly from food processing and agricultural industries, can lead to eutrophication. Numerous substances, such as metals [2], Polycyclic Aromatic Hydrocarbons (PAHs) [3], and biocides [4], have been discovered in treated effluents. Thus, wastewater discharges whether treated or not have negative impacts on the aquatic ecosystem, treating the effluents or wastes before discharge reduces the pollution contamination. Discharges of heated water from power plants and manufacturing industries can raise the temperature of receiving water bodies, altering habitat conditions and negatively affecting species that are sensitive to temperature changes. Sediment deposition occurs when the velocity of the water decreases, reducing its capacity to transport sediment. This can happen due to a decrease in slope or flow rate, or obstacles in the flow, such as rocks, vegetation, or human-made structures.
Sediment transport and deposition are essential for maintaining diverse and healthy aquatic habitats, supporting food webs, and nutrient cycling. Human activities, such as dam construction, river channelization, and deforestation, can disrupt natural sediment transport, leading to erosion or excessive deposition in unintended areas, which can harm ecosystems and infrastructure. Toxin concentrations in water with high suspended sediment content can occasionally rise due to pesticides, certain metals, and other toxins adhering to suspended particles [5]. Industrial discharges can introduce high levels of pathogenic microorganisms into surface waters, particularly when wastewater treatment is inadequate. Wastewater from manufacturing activities has progressively increased due to accelerated urbanization [6].
Effluents from industries like mining and manufacturing can alter the pH of surface waters, making them too acidic or alkaline. The aquatic ecology has been severely damaged by water pollution, necessitating potential remedies [7]. High sediment loads from industrial discharges can increase water turbidity, which reduces light penetration and affects photosynthesis in aquatic plants. Another factor lowering water quality is improper disposal of gravel, sand, and solid debris [8].
However, the main causes of water pollution are natural disasters, industrialization, agriculture, inadequate sewage treatment systems, and inadequate water supplies [9]. Thus, this study concentrates on water quality modeling of wastewater discharges of Ele River Nnewi for the prediction of sediment transport and deposition during the rainy season. The sources of these effluent discharges are from industries located upland before the Ele River which include Chikason industries, RIMCO vegetable oil industries, and the Tummy-Tummy foods industry.
2.Surface water pollution from effluent discharges and wastewater
Pollution of surface waters by effluent discharges from industries has been a significant environmental concern globally. Industrial effluents often contain a variety of hazardous chemicals, including heavy metals (e.g., lead, mercury, cadmium), organic pollutants (e.g., solvents, pesticides), and toxic substances (e.g., cyanides, phenols). These pollutants can have detrimental effects on water quality and aquatic life. For example, the release of untreated wastewater into coastal waters may result in bacterial pollution, rendering the water unsuitable for recreational activities such as swimming [10]. Such contamination can lead to bioaccumulation in aquatic organisms, posing risks to the food chain and human health.
Effluents from industries such as agriculture, food processing, and fertilizers can contain high levels of nutrients, particularly nitrogen and phosphorus. These nutrients contribute to eutrophication, a process that results in excessive growth of algae and aquatic plants, leading to oxygen depletion in water bodies. This condition, known as hypoxia, creates dead zones where aquatic life cannot survive. For example, runoff from farms containing fertilizers can cause lakes to become eutrophic, which kills fish by depleting their oxygen reserves [11].
Industries such as power plants and manufacturing facilities often discharge heated water into nearby rivers and lakes, causing thermal pollution. Elevated water temperatures can reduce dissolved oxygen levels and disrupt the natural thermal regime of aquatic ecosystems, which can be particularly harmful to temperature-sensitive species such as fish and invertebrates.
Industrial effluents can also introduce pathogenic microorganisms into surface waters, including bacteria, viruses, and protozoa. This is particularly concerning for industries like food processing and pharmaceuticals, where wastewater can carry high loads of microbial contaminants. Industrial discharges can alter the pH of receiving waters, making them too acidic or alkaline. For example, effluents from mining and chemical industries often contain acids or bases that can disrupt the pH balance of surface waters. The link between pH and dissolved oxygen levels in water has been highlighted by studies conducted by Brown, et al. [12]. They discovered that the solubility of oxygen also declines with pH, which lowers oxygen availability for aquatic life. Fish and other aquatic animals may suffer as a result of hypoxic circumstances. Moreover, the presence of toxic substances in effluents, such as ammonia, sulfides, and heavy metals, can further exacerbate these effects. Effluents containing suspended solids can increase the turbidity of surface waters, which reduces light penetration and affects photosynthesis in aquatic plants. High turbidity can also smother benthic habitats and clog the gills of fish, leading to reduced oxygen uptake and stress. Persistent pollutants in industrial effluents, such as polychlorinated biphenyls (PCBs), dioxins, and heavy metals, can accumulate in the tissues of aquatic organisms and magnify up the food chain. This bioaccumulation can have severe impacts on top predators, including humans who consume contaminated fish and shellfish.
3. Methodology
3.1 Study area
The study area is located at Umudim Nnewi, Anambra State. The latitudes of the study region Nnewi are 6° 16’ N and 6° 55’ N, while the longitudes are 6° 91’ E and 6° 55’ E. It has a tropical climate. Its yearly average is 200 mm of rain and a mean temperature of 27 °C. The April through October has a lot of rainfall, however, reduced humidity, increased warmth, and little rainfall describe the November through February months. Elevation River is a significant body of water since it fulfills many functions including household and agricultural needs. By 2006, 391,227 people are thought to live in Nnewi, according to the census in Nigeria. With a total area of 1,076.9 square miles (2,789 km2) in the state of Anambra, Nnewi.
Flow velocity was measured using a Geopacks ZMFP-126S hand-held stream flow meter. Stream velocity at the inlet of the major tributary was measured at the surface midstream because flow velocity is greatest at midstream and slowest along the bed and banks due to friction. The measurements were carried out in the rainy season (July and August 2024). Sediments significantly influence the flow properties, because not only does sediment deposition change the natural bathymetry (bed surface level/bottom configuration) it also affects the storage capacity of the channel. Waterbody sedimentation and re-suspension have been examined in many research [13,14].
In the study, the complexity was minimized, as well as the required computing capacity by using two-dimensional (2D) Computational Fluid Dynamics (CFD). The Comsol Multiphysics® Version 5.3a used in this study is a powerful tool that allows the modeling and solving of different types of physical phenomena, based on Partial Differential Equations (PDEs).
3.2 Modeling using computational fluid dynamics model
Several steps are involved in the modeling process of Comsol Multiphysics. These include building up space geometry, selecting the appropriate physics that describes the problem under investigation, assigning values and defining boundaries, and finally meshing.
3.3 Building the geometry of the tributary of Ele river
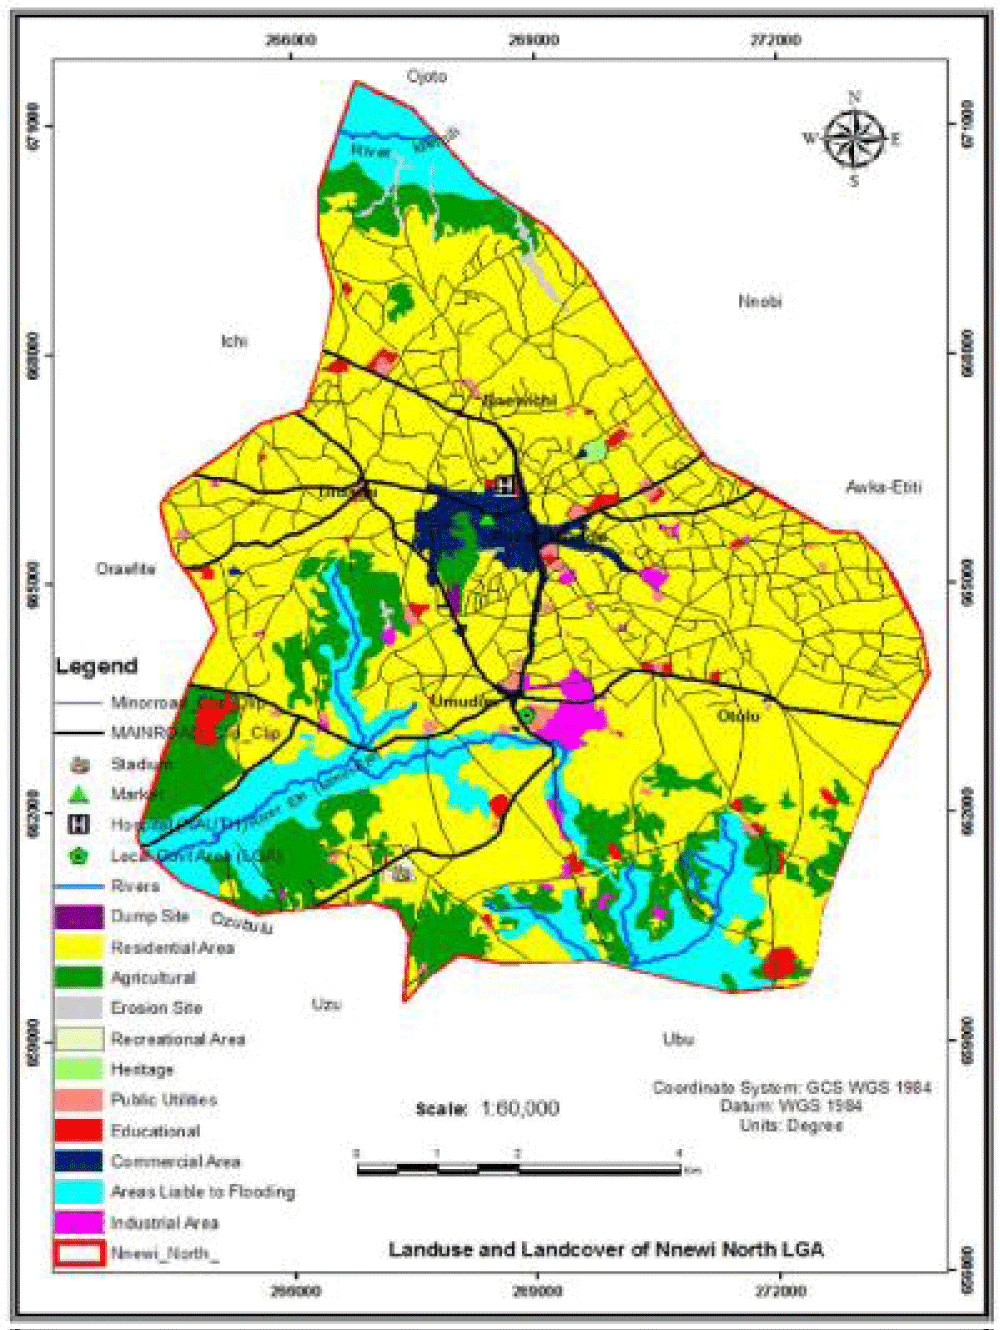
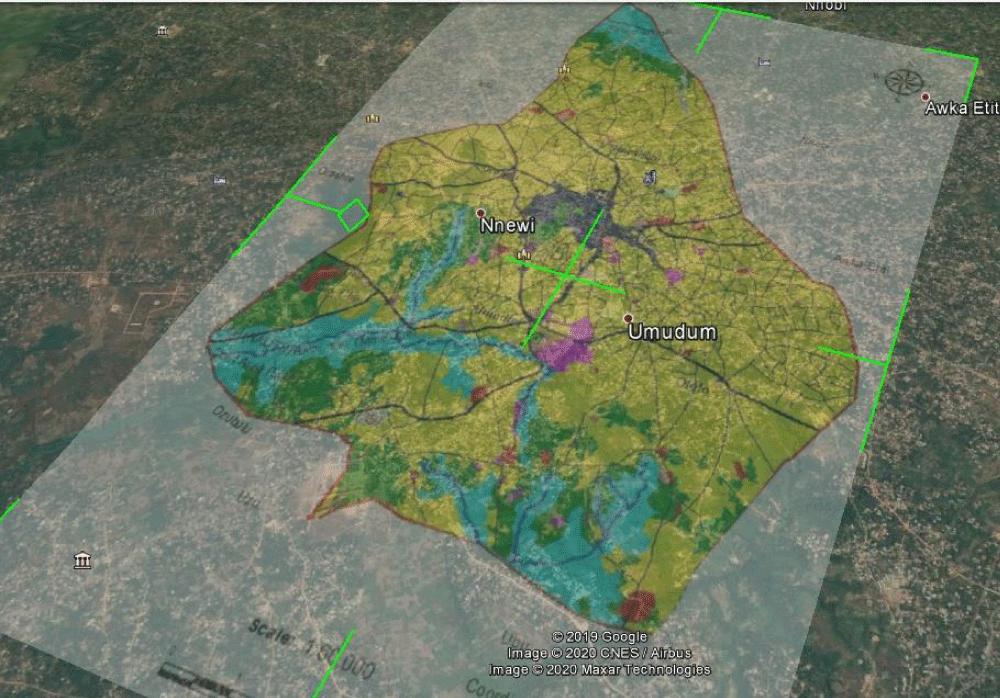
For this study, a 2D geometry of Ele River’s principal tributary was constructed. The choice of 2D model in this research was because it takes a shorter time to run and requires a comparably small amount of computer memory. The first step in building the geometry of the river tributary is georeferencing and digitization. To georeference and digitize the region of interest in the Ele River, a physical vector map of Nnewi North LGA (Figure 3.1) was overlaid over the raster image of the study area in Google Earth as shown in Figure 3.2.
3.4 Selection of module
The first step in selecting the appropriate module that describes the flow of water in the tributary and that models sediment transport is to evaluate the flow conditions (i.e. whether the flow is laminar or turbulent). To do that, the Reynolds Number (Re) of the measured flow velocity was calculated using the following equation:
Where Re is Reynolds Number (Dimensionless); ρ is the density of water (kg/m3); V is the velocity of water (m/s); L is the characteristic of length (m) and μ is the dynamic viscosity of water.
The foundation of flow dynamics in Comsol is provided by the Navier-Stokes equations, which are as follows:
Where ρ is density; u is velocity; p is pressure; τ is viscous stress tensor and F is volume force vector
Equations 3.2 and 3.3 are conservation of mass and Equation 3.25 is conservation of momentum. For a Newtonian fluid, which has a linear relationship between stress and strain, the viscous stress tensor is given as:
Where µ is the dynamic viscosity (Pa.s) and S is the strain-rate tensor given as:
Thus, for a compressible flow, the momentum equation becomes:
When the temperature variations in the flow are small, It is common to assume that a single-phase fluid is incompressible, meaning that ρ is either constant or almost constant. For constant ρ, the continuity equation (Equation 3.3) reduces to
Equation 6 becomes
For particle tracing, the default and most common formulation, the Newtonian formulation was employed. Based on Newton’s second law of motion, it defines a set of second-order ordinary differential equations for the particle position components, which are as follows:
Where q is the particle position (m), mp is the particle mass (kg), and F is the total force on the particles (N).
4. Results and discussion
4.1 Solving the model
Once the modeling processes are completed, the simulation stage can be executed. The simulation process comprised two stages, the first step of the simulation was the steady state determination of hydrodynamic components of flow, particularly velocity field (u) and pressure (p), using the turbulent flow interface. Determination of these components for the flow was necessary for the next step. The second stage was computing the time-dependent particle transmission using a particle flow module. A simulation time of the 2000s was maintained for all the scenarios to estimate the amount of particles transmitted from the inlet to the outlet. A desktop computer (Intel Core i7-2600 Processor at 3.4GHz with 8.00GB RAM) was used to run the simulations. The solution converged and produced particle positions at different times within the system.
4.2 Velocity distribution in modeling and simulation of sediment transport
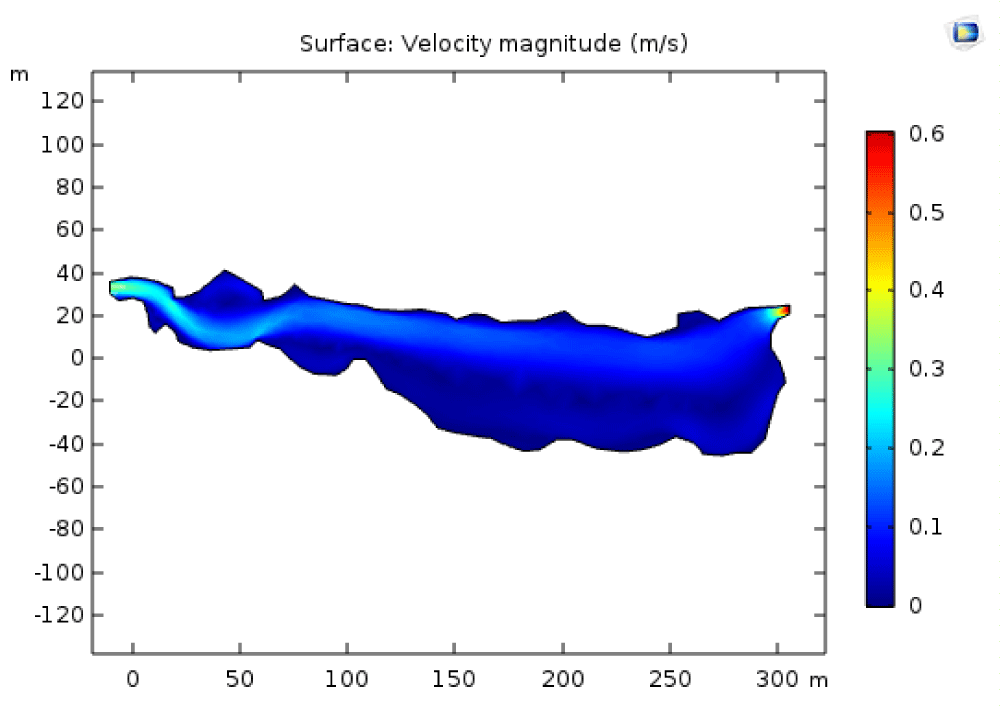
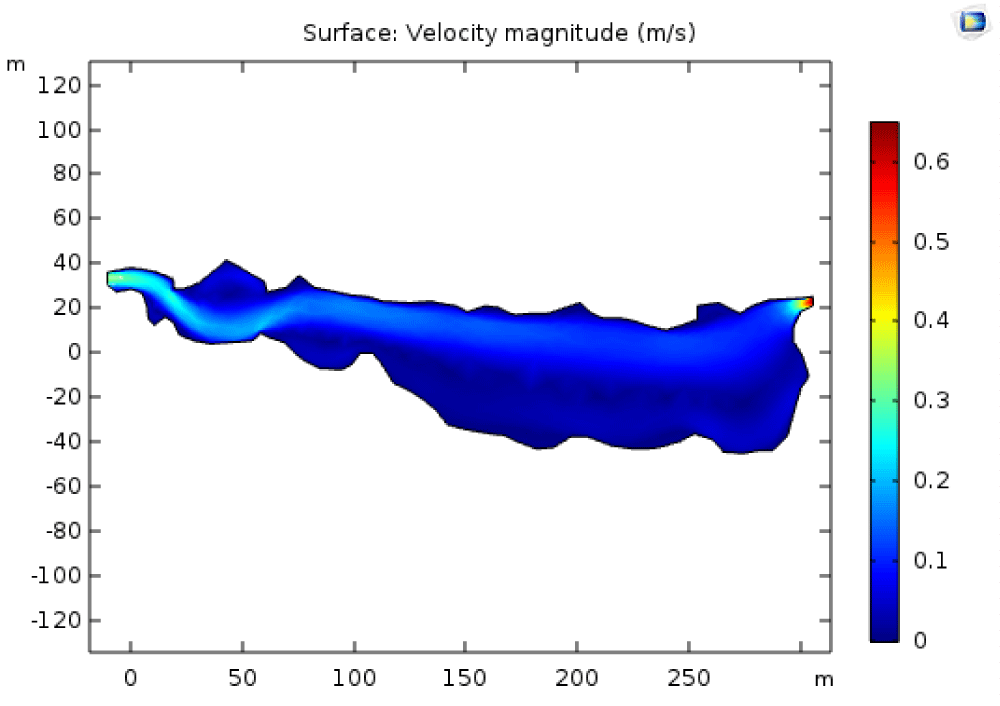
Ele River flow is characterized by a temporal pattern in the flow velocity, the model output for the two-dimensional velocity magnitudes in the river tributary, obtained for July and August 2024 is visualized in figures 4.1 and 4.2. Based on the color range displayed outside the model, the maximum flow velocity of the model can be determined. Flow velocity at locations within river tributary geometry can be identified by clicking at the point around the location and the system will pop up the value of the velocity.
Firstly, the direction of flow from the inlet towards the outlet can be identified. Furthermore, the parts of the river channel where the flow intensity was greater can be distinct. Dead zones, which are regions of stagnation or extremely low flow velocity—occurred near the banks of the river tributary, as can be seen from the 2D plot.
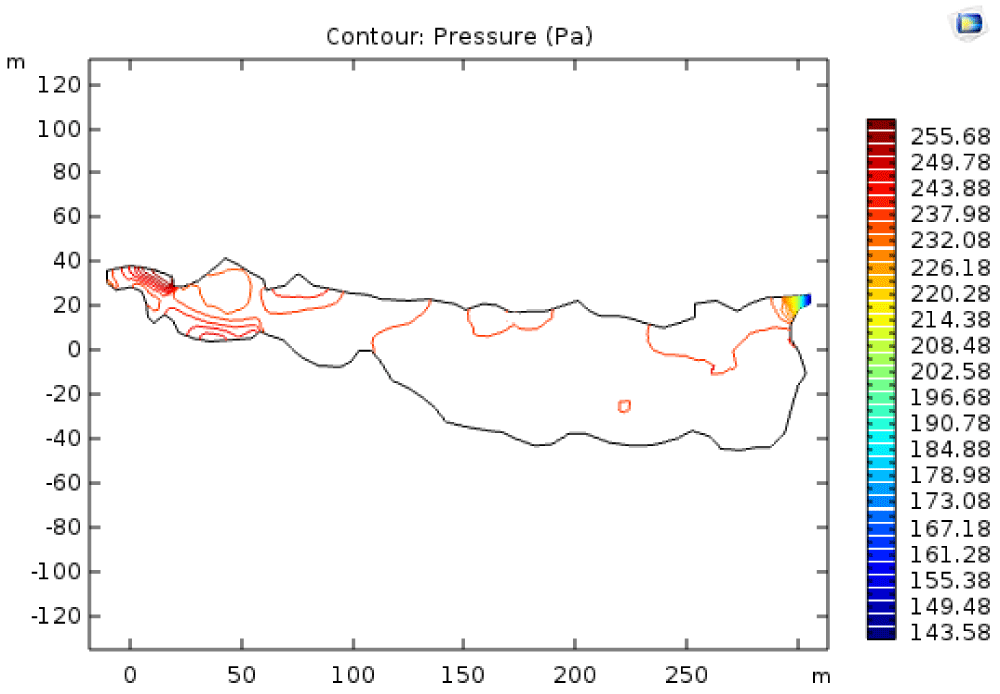
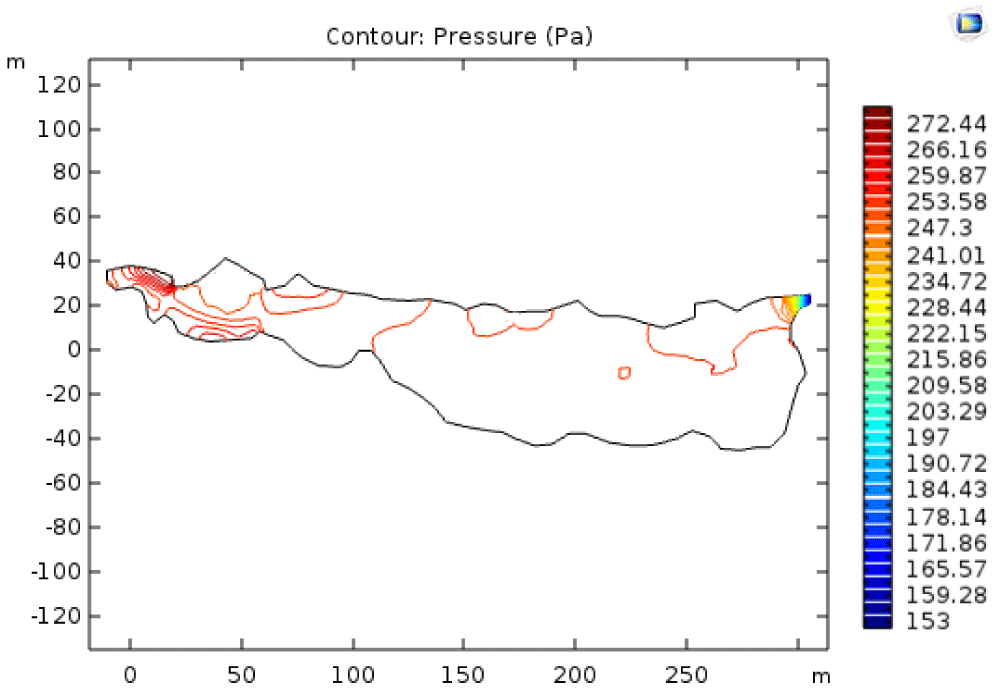
The model output for pressure in the water channel, obtained for July and August in the first stage of simulation is visualized in Figures 4.3 and 4.4. Pressure at different locations within river tributary geometry can be identified by clicking at the point around the location and the system will pop up the value of the velocity.
4.3 Validation
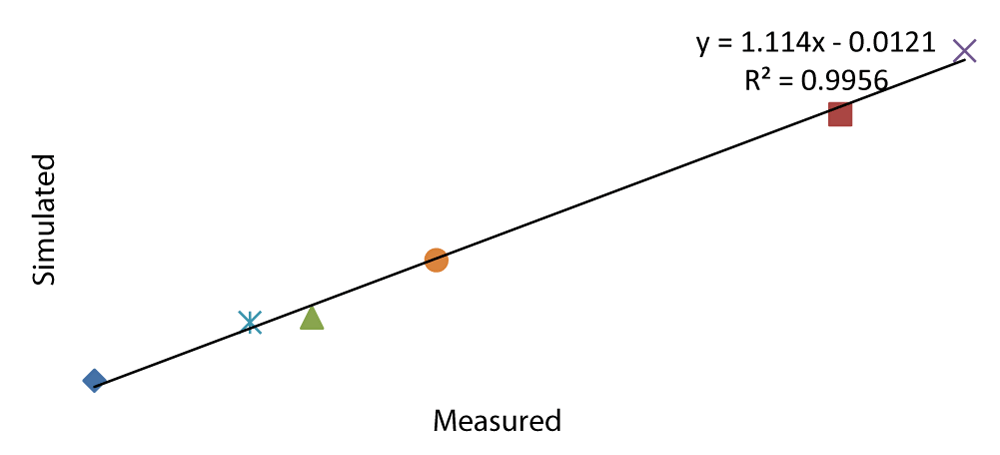
Particle transmission is governed by the flow velocity and as such it is enough to validate the flow velocity from the model. To validate the model used in the simulation, the measured velocity at 6 sampling points was compared to simulated flow velocity values. The values of the two velocities and their percentage differences are presented in Table 4.1.
The percentage difference between the measured and simulated flow velocities was in the range of 2.6% to 10.4% in 2024. Apart from the percentage difference, the correlation between the measured and simulated velocity was evaluated using the correlation coefficient (R2) value. The correlation between the two velocities is presented in Figure 4.5.
4.4 Particle transmission
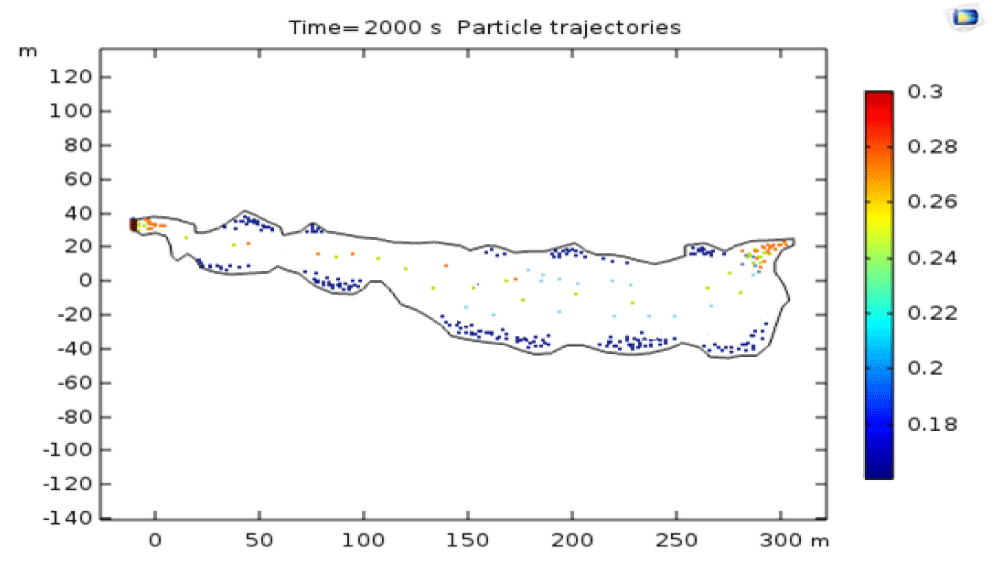
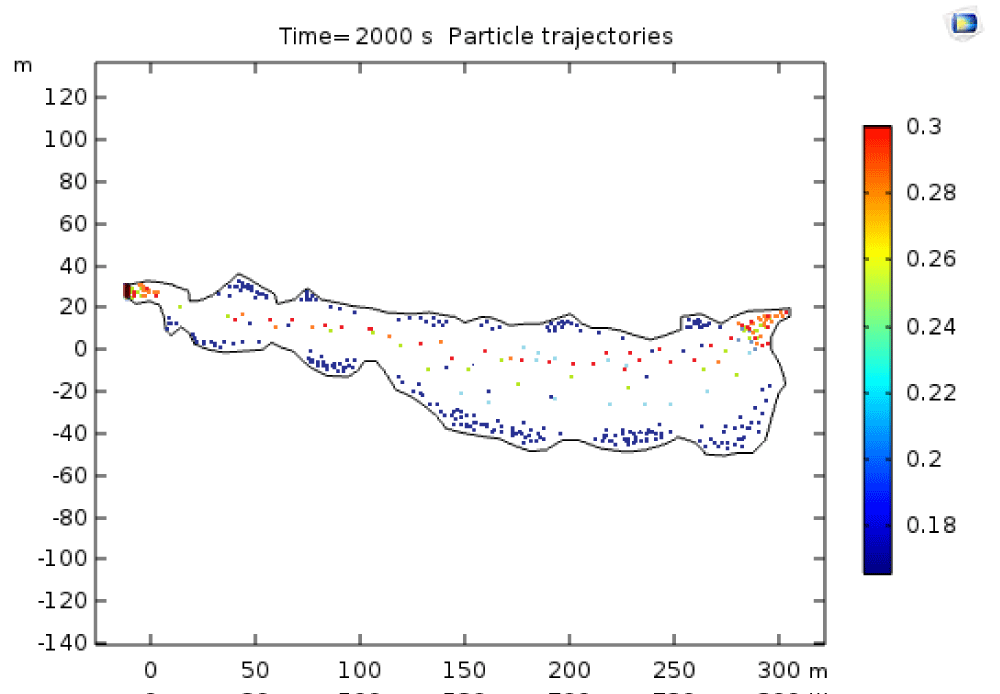
The flow velocity in the channel had an impact on the particle’s motion. The results of the simulation of the trajectories of the particle from the inlet to the outlet of the river tributary for all the simulated conditions after 2000 sec simulation time are visualized in Figures 4.6 and 4.7.
The particle trajectory provided adequate information about sediment transport in the Ele River tributary. For all the simulated conditions, the particles at the banks had lower velocities compared to particles midstream. From the results of the simulation, it is evident that higher sediment deposition occurs at the banks due to stagnation. By using the transmission probability function in the particle tracing module, it was able to estimate the number of particles. The color at the midstream of the river shows the sediment transportation level while the color at the edge of the graph shows the sediment deposition. The percentage of the particle transmitted from the inlet to the outlet after 2000 sec simulation time was calculated.
5. Conclusion
This study employed CFD using Comsol Multiphysics software for the modeling and simulation of the flow and particle transmission in the Ele River tributary. The differences between the simulated and measured values were within acceptable limits. The model was able to explain 99% of the variability in the data set. The CFD model was able to highlight areas with a higher risk of sediment deposition, which can be used in the management of sediment load in the river. Higher sediment deposition occurred at the banks of the River due to stagnation since the particles at the River banks had lower velocities compared to particles midstream. This sediment deposition will also affect the irrigation system for crop production considering the ability of the sediments to block sprinkler nozzles which limits it from supplying sufficient water for crop production. Finally, these high contaminations due to water salinity which causes salt deposits in the crop root zones will require the application of excess water to crops to meet up with the leaching requirements for crop growth. However, wastewater treatment will be preferable for the supply of good water of low conductivity for optimum crop production.
6. Limitations of the study
This study is limited to water quality modeling of wastewater discharges for the prediction of sediment transport and deposition in surface water during the rainy season, precisely in July and August 2024.
The authors hereby express their gratitude to Tetfund for the research grant given to fund this study.
- Ubah JI, Orakwe LC, Okoye NM, Ogbu KN. River sediment transport modeling of Ele River using computational fluid dynamics model of COMSOL Multiphysics program. ASM Sci J. 2021;16:562. Available from: https://doi.org/10.32802/asmscj.2021.562.
- Jones L, Sullivan T, Kinsella B, Furey A, Regan F. Occurrence of selected metals in wastewater effluent and surface water in Ireland. Anal Lett. 2017;50:724–737. Available from: https://doi.org/10.1080/00032719.2016.1194854.
- Qiao M, Bai Y, Cao W, Huo Y, Zhao X, Liu D, Li Z. Impact of secondary effluent from wastewater treatment plants on urban rivers: polycyclic aromatic hydrocarbons and derivatives. Chemosphere. 2018;211:185–191. Available from: https://doi.org/10.1016/j.chemosphere.2018.07.167
- Münze R, Hannemann C, Orlinskiy P, Gunold R, Paschke A, Foit K, et al. Pesticides from wastewater treatment plant effluents affect invertebrate communities. Sci Total Environ. 2017;599–600:387–399. Available from: https://doi.org/10.1016/j.scitotenv.2017.03.008.
- Osuagwu JC, Nwachukwu AN, Nwoke HU, Agbo KC. Effects of soil erosion and sediment deposition on surface water quality: A case study of Otamiri River. Asian J Eng Technol. 2014;2(5):438-442. https://ajouronline.com/index.php/AJET/article/view/1711
- Wu H, Gai Z, Guo Y, Li Y, Hao Y, Lu ZN. Does environmental pollution inhibit urbanization in China? A new perspective through residents’ medical and health costs. Environ Res. 2020;182:109128. Available from: https://doi.org/10.1016/j.envres.2020.109128.
- Ubah JI, Orakwe LC, Ogbu KN, Awu JI, Ahaneku IE, Chukwuma EC. Forecasting water quality parameters using artificial neural network for irrigation purposes. Sci Rep. 2021;11:24438. Available from: https://doi.org/10.1038/s41598-021-04062-5.
- Ustaoğlu F, Tepe Y, Taş B, Pag N. Assessment of stream quality and health risk in a subtropical Turkey river system: A combined approach using statistical analysis and water quality index. Ecol Indic. 2020;113:105815. Available from: https://doi.org/10.1016/j.ecolind.2019.105815.
- Lin L, Yang H, Xu X. Effects of water pollution on human health and disease heterogeneity: A review. Front Environ Sci. 2022;10:880246. Available from: https://doi.org/10.3389/fenvs.2022.880246
- Mohanty B, Swain Hauzoukim S. A review on fish processing wastes generation in India and its further utilization prospects into different value-added compounds. Indian J Nat Sci. 2020;24:177–182.
- Yakamercan E, Aygün A. Ecological risk assessment of domestic sewage sludge: A case study. Sigma J Eng Nat Sci. 2021;39(4):422–433. Available from: https://pdfs.semanticscholar.org/cc31/6d10a5ecd1d414bcf3021a0493152f1686c6.pdf
- Brown CJ, Barlow JRB, Cravotta CA, Lindsey BD. Factors affecting the occurrence of lead and manganese in untreated drinking water from Atlantic and Gulf Coastal Plain aquifers, eastern United States-Dissolved oxygen and pH framework for evaluating risk of elevated concentrations. Appl Geochem. 2019;101:88–102. Available from: https://doi.org/10.1016/j.apgeochem.2018.10.017.
- Visescu M, Beilicci E, Beilicci R. Sediment transport modeling with advanced hydro informatics tool case study - modeling on Bega channel sector. Procedia Eng. 2016;161:1715–1721. https://www.researchgate.net/profile/Mircea-Visescu/publication/309271008_Sediment_Transport_Modelling_with_Advanced_Hydroinformatic_Tool_Case_study_-_Modelling_on_Bega_Channel_Sector/links/5f102f4f92851c1eff156e23/Sediment-Transport-Modelling-with-Advanced-Hydroinformatic-Tool-Case-study-Modelling-on-Bega-Channel-Sector.pdf
- Amoudry LO, Souza AJ. Deterministic coastal morphological and sediment transport modeling: A review and discussion. Rev Geophys. 2011;49. Available from: https://doi.org/10.1029/2010RG000341
- Ezeomedo IC, Igbokwe JI. Mapping of urban features of Nnewi metropolis using high-resolution satellite image and support vector machine classifier. J Environ Earth Sci. 2019;9(6). Available from: https://www.researchgate.net/publication/334139624_Mapping_of_Urban_Features_of_Nnewi_Metropolis_Using_High_Resolution_Satellite_Image_and_Support_Vector_Machine_Classifier
Article Alerts
Subscribe to our articles alerts and stay tuned.
 This work is licensed under a Creative Commons Attribution 4.0 International License.


 Save to Mendeley
